Dashboard Formulas
Metric AI allows you to not only display various metrics but also create custom formulas for calculations. This feature gives you the flexibility to calculate specific values directly on your dashboards.
Example:
One useful calculation for service businesses is Revenue per Employee, which
shows the revenue generated per team member. To set this up, you could add the
Revenue and Headcount metrics to your dashboard (they can be hidden if needed)
and then create a formula card using Revenue / Headcount. This formula
provides valuable insight into team productivity and overall efficiency.
You can add formulas anywhere you would typically add a metric:
With formulas, you have full control to create tailored calculations, making your dashboards more powerful and adaptable to your needs.
Adding a Formula as a Card
- Prepare the Metrics:
Add the individual metric cards to the dashboard that you’ll use in the formula. You can hide these metric cards if they aren’t needed in the final view.

- Add a Formula Card:
- Select the Formula Type when adding a new card.
- Set the Title for this card, which will display on the dashboard.
- Choose a Unit (e.g., Amount, Hours, Percentage, Number) for consistency with other data.
- Enter the Formula: Use previously added metric cards in the formula and
combine them with operators like
+,-,*,/, and()as needed.

- The formula card will display on your dashboard just like any other metric card.

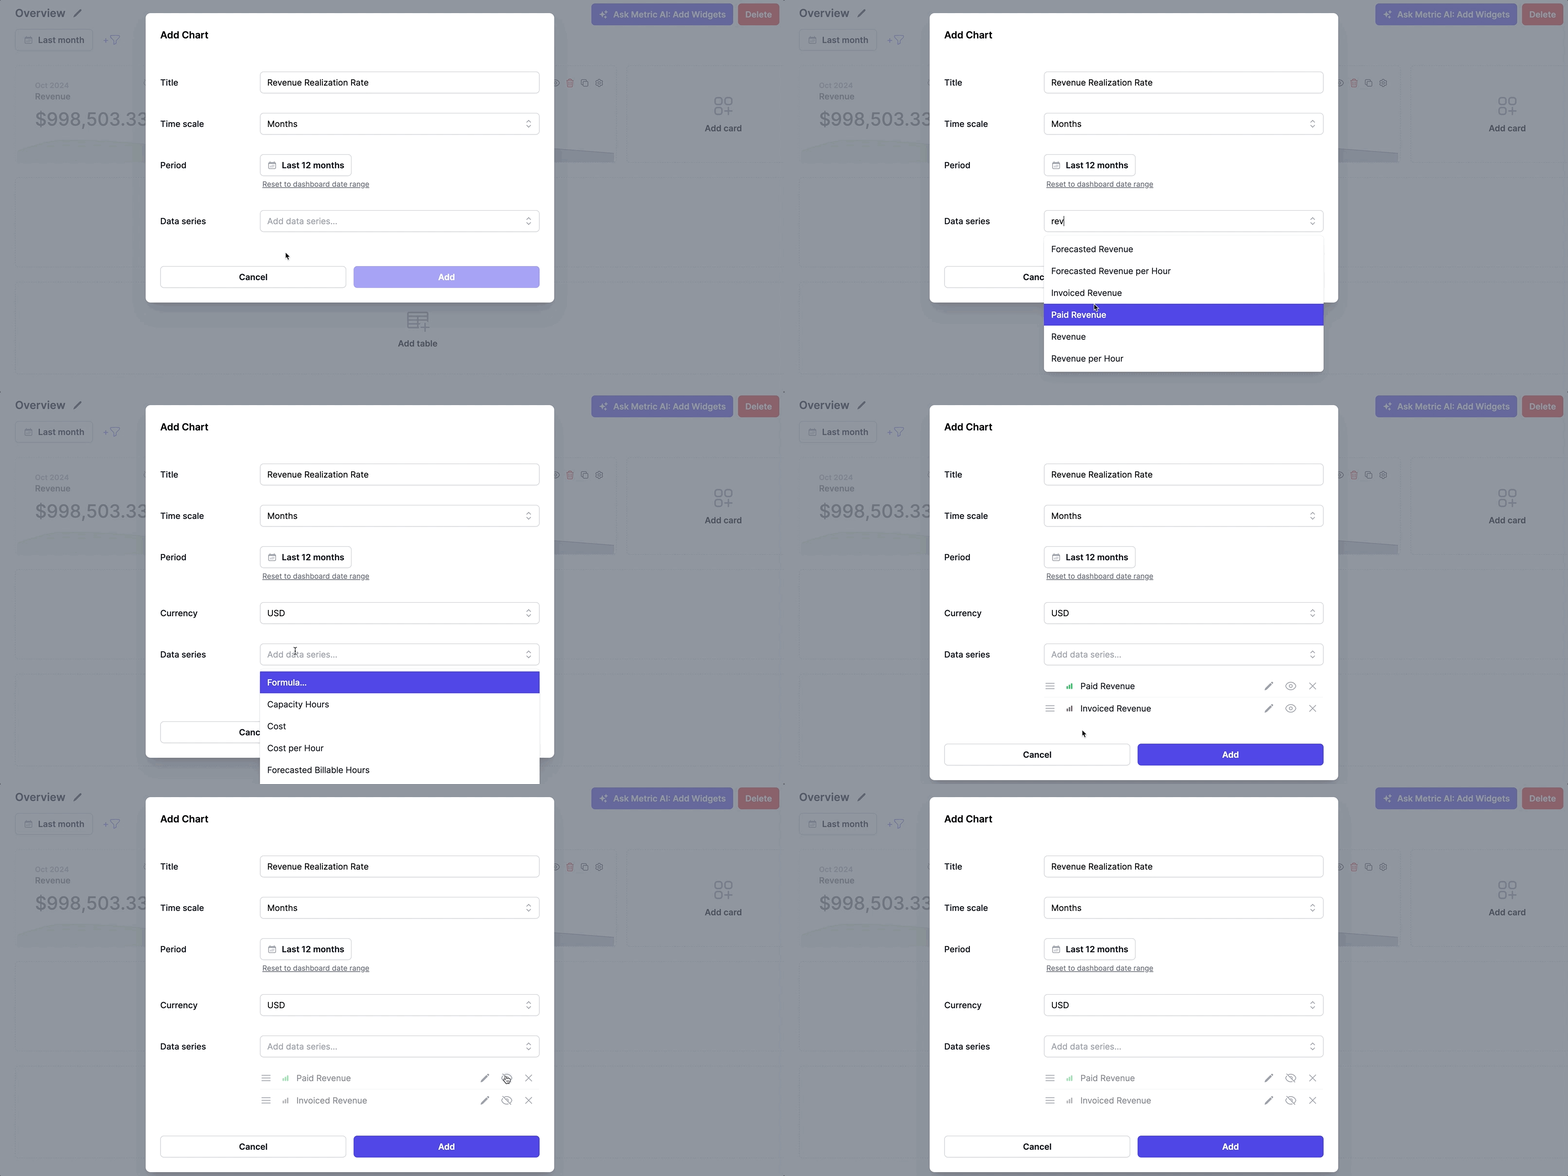
Adding a Formula as a Data Series on a Chart
- Prepare the Metrics on the Chart:
Add the necessary metrics to the chart that you’ll use in the formula. You can hide these metrics if they don’t need to appear on the final dashboard.

- Add a Formula Data Series:
- Select Formula when adding a new data series.
- Set the Title for this data series, which will display on the chart.
- Choose a Unit (e.g., Amount, Hours, Percentage, Number) to match the data format.
- Enter the Formula: Use metrics already added to the chart and combine
them with operators like
+,-,*,/, and()as needed.

- The formula data series will appear on your chart as a regular metric.

Adding a Formula as a Column in a Table
-
Prepare the Metrics in the Table:
Add the necessary metric columns to the table that you’ll use in the formula. You can hide these columns if they aren’t needed in the final view. -
Add a Formula Column:
- Select Formula when adding a new column.
- Set the Title for this column, which will display in the table.
- Choose a Unit (e.g., Amount, Hours, Percentage, Number) for consistent data formatting.
- Enter the Formula: Use metrics already added to the table and combine
them with operators like
+,-,*,/, and()as needed.

- The formula column will be displayed as a regular metric column in your table.
